

Motorway bridge: live and long-term crack monitoring in the box girder
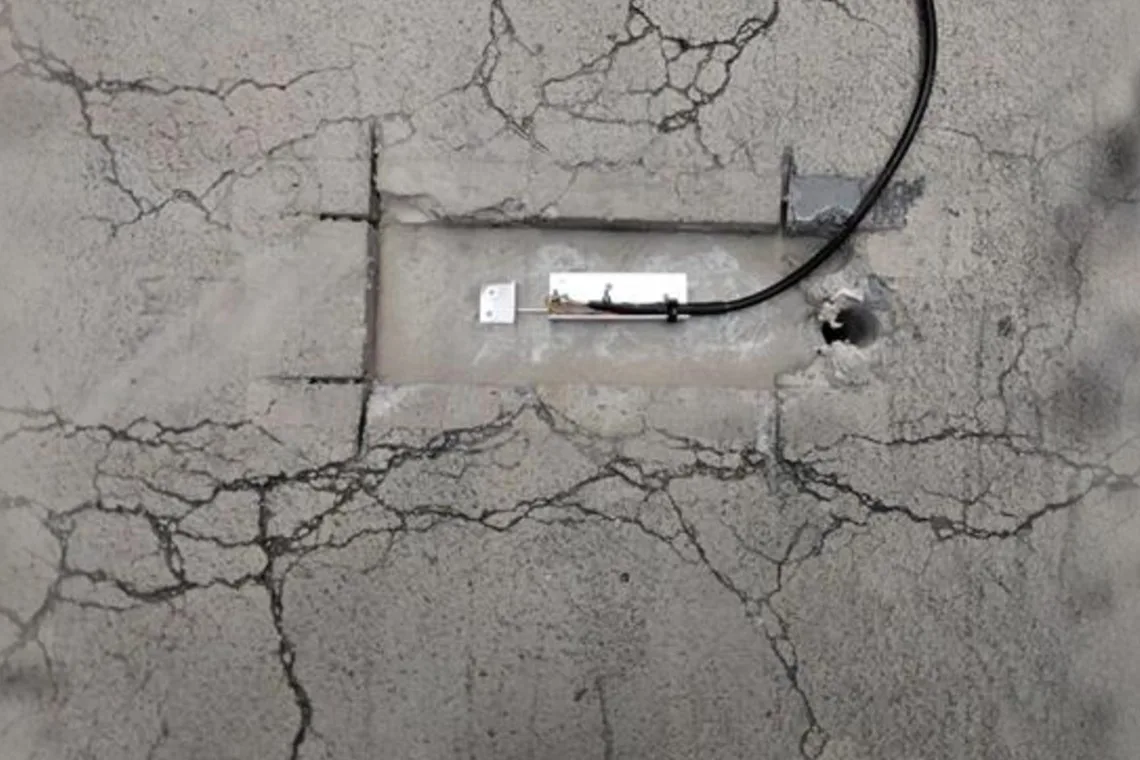
Project facts
- Structure
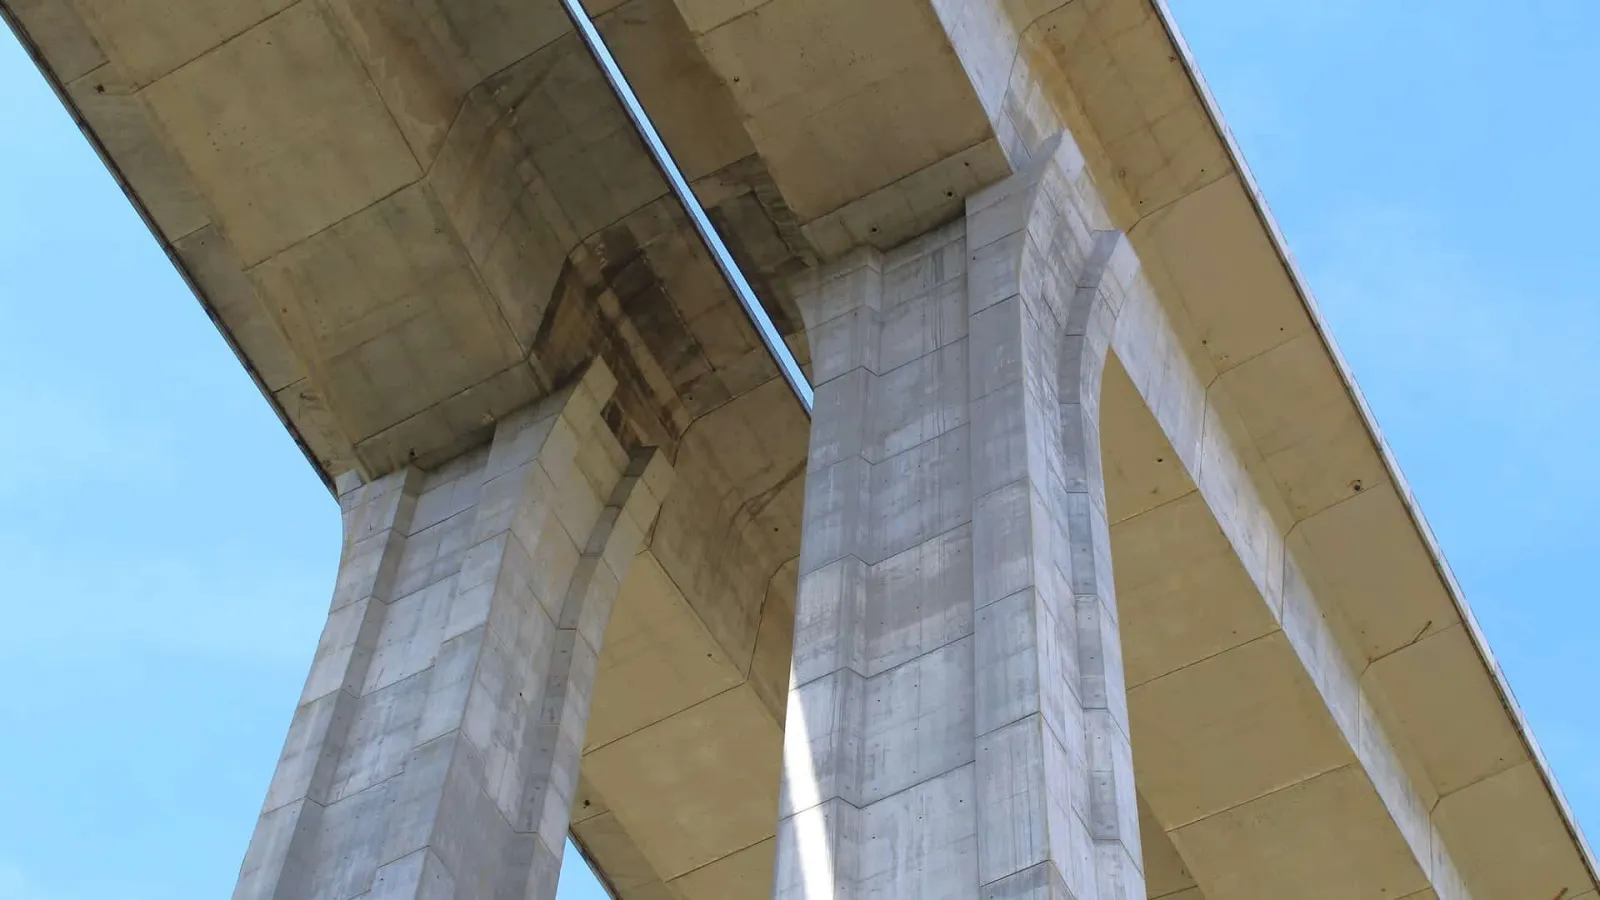
- Prestressed concrete motorway bridge, box girder, 1960s
- Client
- Die Autobahn GmbH des Bundes
- Task
- Measure and assess crack movements on the bottom slab after a special inspection
- Installed sensors
- Four displacement transducers (10 mm) on the live gateway, then on the long-term gateway
Installed sensors
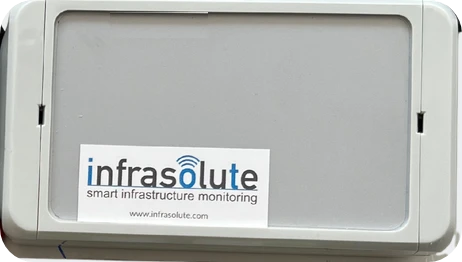
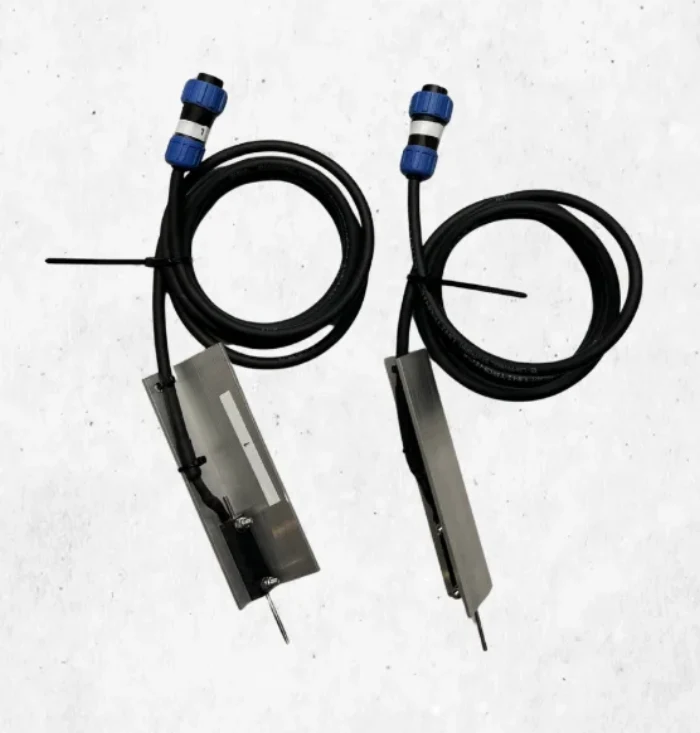
At a glance

- Structure: Prestressed concrete motorway bridge, box girder, 1960s
- Client: Die Autobahn GmbH des Bundes
- Reason: Damage found in a special inspection, cracks on the bottom slab inside the box girder
- Solution: Live phase with four displacement transducers at 1 Hz, then long-term monitoring with the same transducers
Challenge
How strongly do the cracks move under traffic?
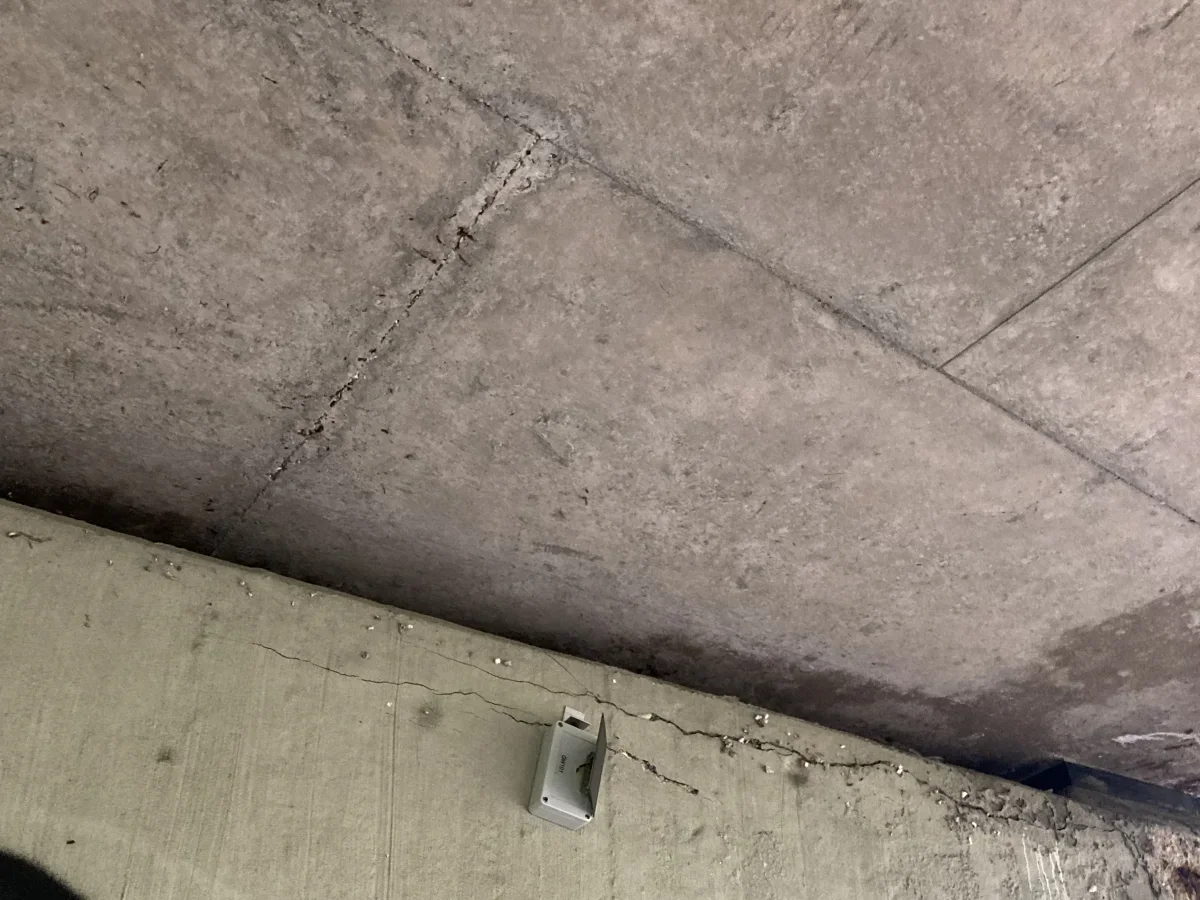
A special inspection found considerable damage inside the box girder of a prestressed concrete bridge from the 1960s, including cracks on the bottom slab. To assess the structure, Die Autobahn GmbH needed reliable answers: how far do the cracks open and close under heavy traffic? What share does temperature have? Do the cracks change over time?
Hourly measurement would have answered the third question, but not the first two. A lorry crossing takes seconds and can no longer be seen in an hourly value.
Solution
Measure live first, then monitor long-term
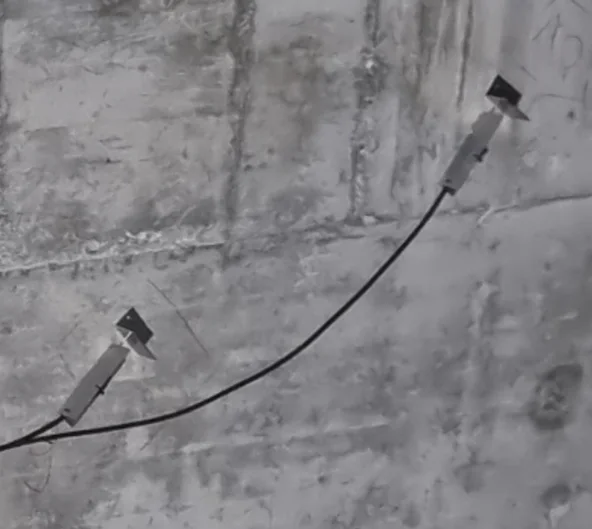
Infrasolute installed four displacement transducers with a 10 mm measuring range and a resolution down to 0.001 mm across the cracks and connected them to the live gateway. From 25 June to 1 August 2026, the measurement ran at 1 Hz, 898 hours in total. The readings went live to the Infrasolute platform via LTE and were stored on a USB stick in parallel.
For the subsequent long-term monitoring, the displacement transducers stay where they are. They are re-plugged via their IP68 connectors into the long-term gateway, which measures hourly and transmits via NB-IoT, with alerts when thresholds are exceeded. No second installation is needed. The technology behind it: the Crack Sensor Live for the live phase and the Crack Sensor for long-term measurement.
Result
What the live data showed
Traffic. A load event was defined as a step of at least 10 µm/s at three or more measuring points. In 898 hours there were 264,960 events. Their daily number followed the lorry toll data with a correlation of r = 0.98. On Sundays, when lorries are banned, it was around a tenth. This shows that the short crack movements come from heavy traffic.
Temperature. Over the day, the crack width follows the air temperature, with a lag of four to five hours and 3.9 to 5.9 µm per degree. The median daily fluctuation was 83 µm, and all four measuring points moved largely in sync.
Trend. After removing the temperature component, a similar change over the weeks remained at all measuring points. A forecasting model on the platform describes this trend and was checked in a blind test over the final days of measurement.
Measuring interval. The live data were used to check which interval is sufficient for the long-term phase. Four readings per day captured a median of 96 % of the daily fluctuation, 70 % on the least favourable day. Hourly readings capture it completely and were recommended for long-term monitoring.
898 h
live data at 1 Hz
264,960
load events detected
r = 0.98
events per day against lorry toll data
83 µm
daily fluctuation of the crack width (median)
Structure not named at the client’s request.
Benefit for the operator
Thresholds based on measured behaviour
After the live phase, the operator knows the normal behaviour of the cracks: how far they usually move under traffic and temperature. Warning and alarm thresholds for long-term monitoring are set above this instead of being estimated. Normal movements do not trigger alarms, real changes stand out. Load, temperature and trend are separated, a sound basis for structural analysis and reassessment.
The project shows how crack monitoring can combine the live and long-term variants, as part of bridge monitoring and related to traffic load monitoring. How the platform separates load and temperature is described on the AI analytics page.
Specifics
- Live phase
- 898 hours at 1 Hz, stored locally on USB and in parallel in the cloud
- Traffic
- 264,960 load events, daily number correlated with lorry toll data (r = 0.98)
- Temperature
- Crack width follows the air temperature with a lag of four to five hours
- Long-term
- The same transducers plugged into the long-term gateway, hourly via NB-IoT
Products in use
Sensors installed here
Related solutions & industry
Solutions matching this project
Infrasolute platform
How the readings from this project are evaluated
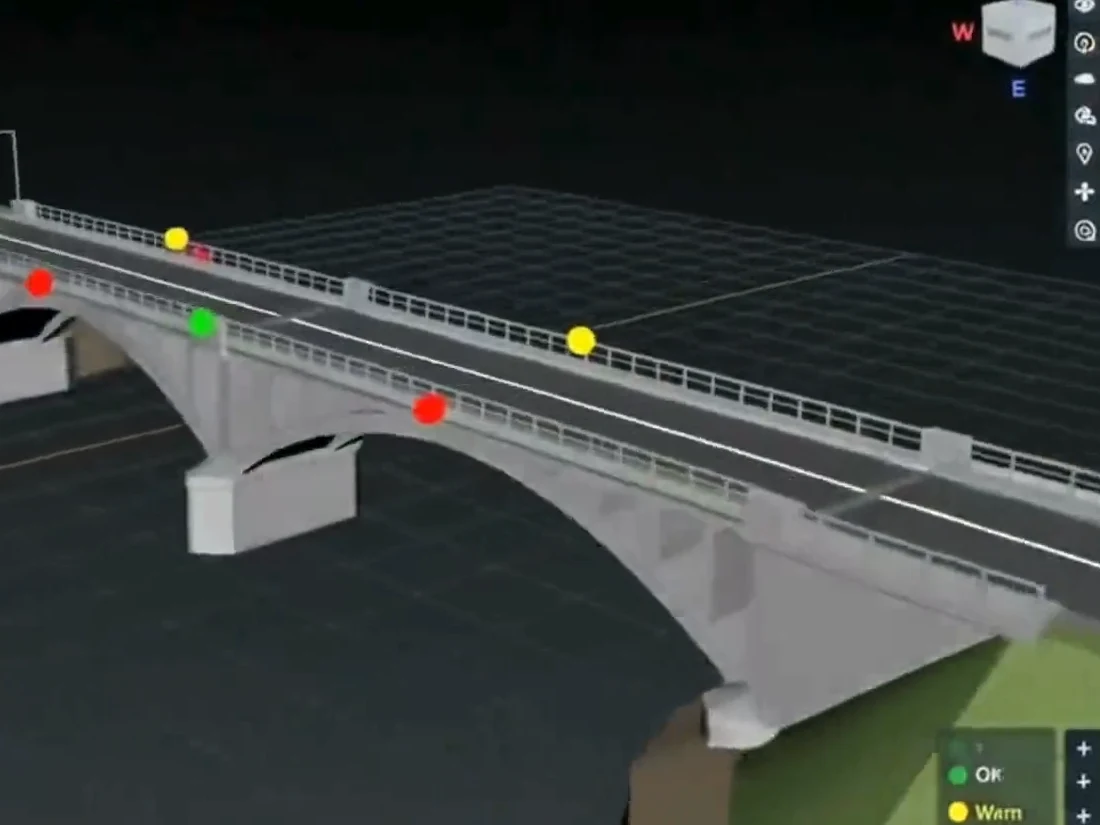
The readings from this project come together on the Infrasolute platform. There they are checked against the defined limits, shown as trends and interpreted with AI.
Platform modules
Frequently asked questions: Motorway bridge
Why was the crack measured live first?
How were load events detected?
Which measuring interval is sufficient for long-term monitoring?
Do the displacement transducers have to be remounted for long-term monitoring?
Project inquiry
A comparable structure to monitor?
Describe your structure and your question. We recommend the right measuring points and suitable sensors.
 Peter Nater

More projects
More references in bridges
Project inquiry
Tell us about your structure
Structure type, location and your question are enough to start. We recommend suitable measuring points and sensors.
+49 6742 8599600 DE +41 41 670 00 11 CH [email protected]