

AI analytics in structural health monitoring: turning data series into findings
The Infrasolute platform does not only check readings against limit values. The AI reads them against weather and traffic data, detects anomalies in the trend and answers questions about the data directly in the dashboard.
- Weather and traffic data
- Anomalies in the trend
- Questions in dialogue
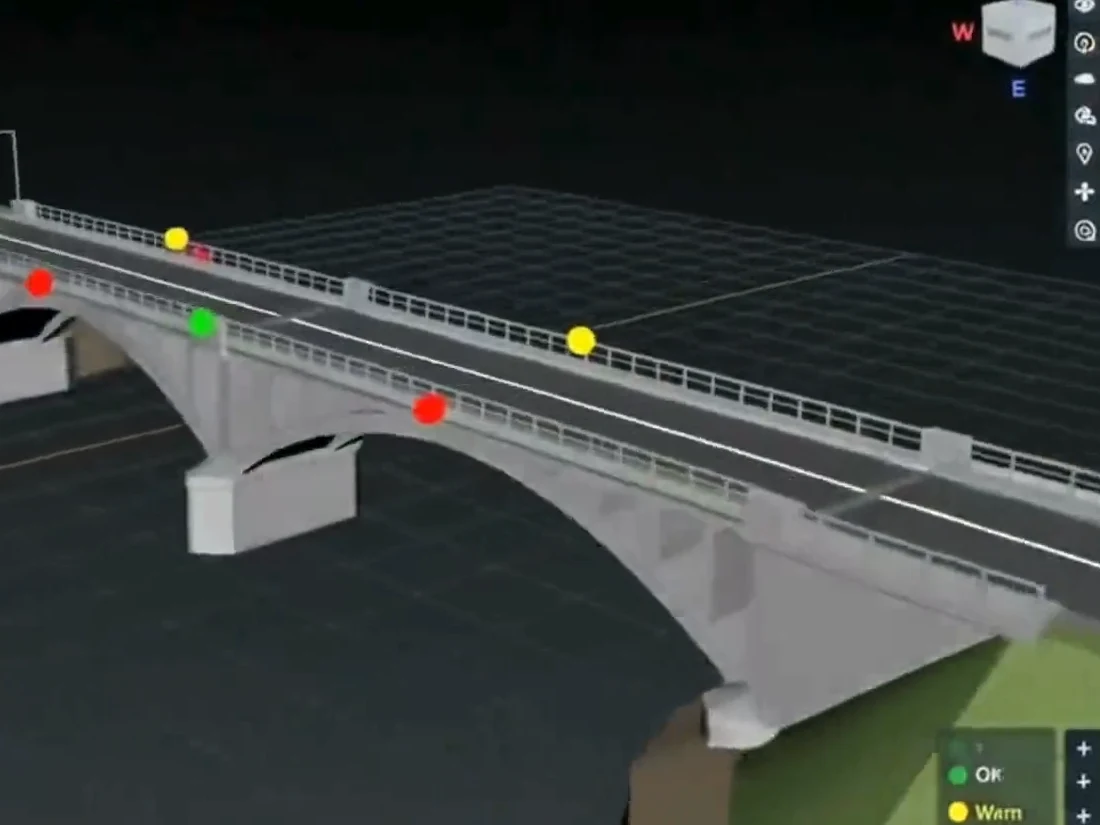
What does AI analytics do in structural health monitoring?
AI analytics in structural health monitoring means that the data platform continuously evaluates the data series of a structure and puts changes into context: it detects anomalies in the trend before a limit value is reached and distinguishes, for example, a temperature- or traffic-related movement from a structural one. The engineering assessment stays with engineers; the AI shortens the path from the curve to a reliable finding.
What AI analytics delivers
Detect earlier, interpret better
A limit value only reports once it is reached. Analysing the trend shows whether something is developing, and why.
Anomalies in the trend
The evaluation looks at changes in the trend, not only at a threshold being exceeded. This brings the moment of notification forward.
Correlation of quantities
Several measured quantities are read against each other, such as crack width against concrete temperature. A single curve is rarely conclusive; the interplay is.
Weather and traffic data as context
Temperature, rainfall and wind run as a separate data track, and on bridges traffic data can be added on request. Only with this can a weather- or traffic-related movement be distinguished from a structural one.
Questions to the data
In the dashboard you ask a question, the AI pulls in the relevant data series and presents the result.
All sources in one interface
Existing measuring equipment from other manufacturers and findings from inspection reports are included. The analysis sees the whole structure.
Limit values remain decisive
Alerting remains tied to the defined warning and alarm thresholds. The AI complements them; it does not replace them.
Interpretation in detail
Weather, traffic, anomalies: how the AI interprets readings
A reading on a structure almost never has a single cause. Temperature, moisture and traffic move it every day; damage moves it slowly and often inconspicuously. The task of the analysis is to separate these components.
Temperature and weather: the largest influence
Concrete and steel expand when they warm up and contract when they cool down. Cracks open on cold nights and close on warm afternoons; joints and bearings follow the seasons. These movements are normal and often larger than the change you are actually looking for.
The AI therefore reads every measured quantity against temperature, humidity, rainfall and wind from the nearest weather station. The data series shows how the structure typically responds to the weather. Whatever this expected behaviour explains is recognised as weather influence. What remains is the signal that matters.
Traffic data: which movement the traffic explains
On bridges carrying busy roads, a second influence comes into play: traffic. Every heavy vehicle briefly deforms the structure, and strains and vibrations follow the traffic volume over the day and over the week. When traffic data is integrated, such as traffic volume and the share of heavy goods vehicles from the operator’s counting stations, the AI also reads the readings against the traffic.
One example is a motorway bridge on one of Germany’s major north-south routes. There, the readings on the structure are compared with the traffic data. The pattern the analysis looks for is clear: on weekdays, the load follows the lorry traffic; on Sundays, when the lorry ban applies, the structure becomes quieter. Whatever follows this pattern is explained by traffic. Whatever deviates from it deserves a second look.
This answers three questions. Is a peak a load spike from traffic or a change in the structure? Does the structure respond differently today to the same traffic load than it did a year ago? And how do traffic management, closures or diversions affect the loading?
Anomalies: what the AI flags as unusual
Once weather and traffic are taken out, a residual signal remains. The AI knows its normal behaviour from the data series so far and flags whatever deviates from it, even before a limit value is reached. Typical anomalies are:
A reading changes suddenly and stays at the new level, for example after an impact or an exceptional load event.
A reading moves slowly in one direction, independently of weather and traffic. The typical picture of progressing damage.
The structure responds differently to temperature or traffic than before, for example because a bearing is sticking or a crack no longer closes.
Peaks or scatter that do not occur in the data series so far.
If several sensors change at the same time, this points to a cause in the structure rather than a single outlier.
Values that are not physically plausible are flagged as a possible measurement fault and distinguished from a change in the structure.
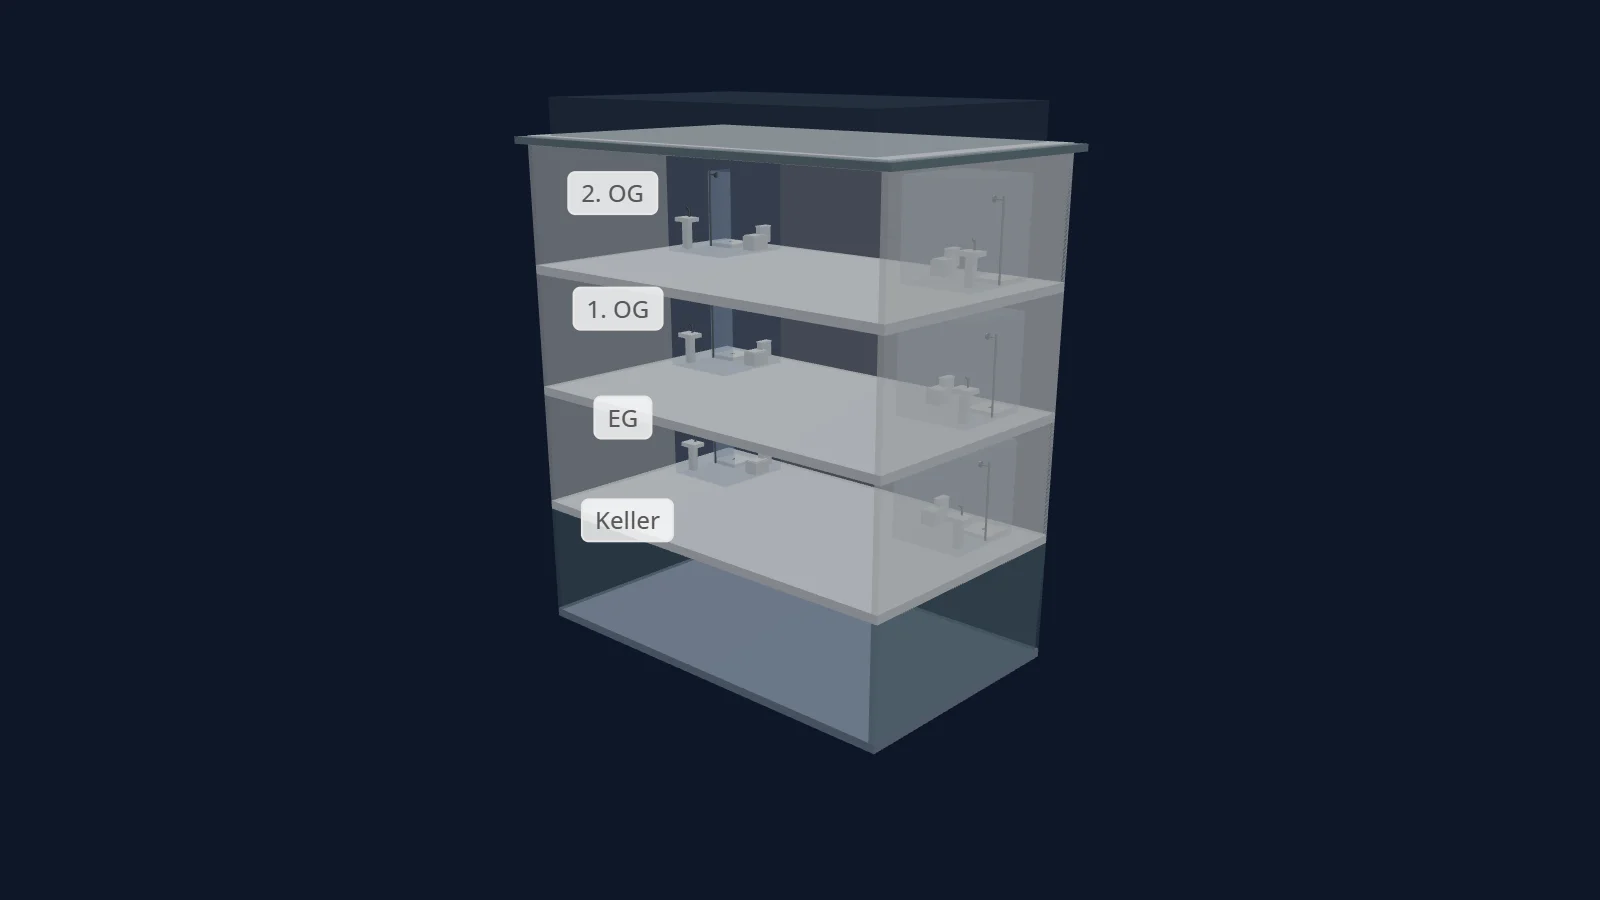
Every anomaly is shown with its context: which measuring point, since when, and what the weather and traffic looked like during that period. Whether a measure follows is assessed by engineers. The warning and alarm thresholds are unaffected and alert as usual.
How the analysis works
From reading to finding in four steps
The sensors send their values autonomously to the data platform. The evaluation starts with every new reading.
- 01
Capture
Readings, weather data, traffic data on request and values from third-party sensors come together on one platform.
- 02
Validate
Every reading is checked for plausibility and shown as a time series.
- 03
Interpret
The AI separates weather and traffic influence from the residual signal, reads quantities against each other and flags anomalies.
- 04
Assess
Engineers assess the anomaly. The result is a statement on the condition of the structure.
For whom
What engineers and decision-makers gain
For engineers and inspectors
- Trends instead of single values, with weather and traffic context
- Correlations of several quantities at a glance
- Third-party sensors and inspection findings in the same interface
- The engineering assessment stays with people
For operators and decision-makers
- Earlier indication of changes, before a limit value is reached
- Weather- and traffic-related movements become recognisable as such
- Answers to questions without data exports and spreadsheets
- A sound basis for decisions on measures
Limits of AI analytics: The AI evaluates what is measured. It replaces neither a well-designed monitoring concept nor the mandatory structural inspection or the engineering assessment.
Read on
Where AI analytics starts
The analysis is only as good as the data behind it. These pages show where the data comes from and what follows from it.
Evaluate your data with AI
Whether new measuring points or existing sensors: we show you with an example how the platform interprets your data series.
 Roman Koch

Frequently asked questions: AI Analytics
What exactly does the AI do in structural health monitoring?
Does the AI replace the limit value alarm?
How does the analysis distinguish weather from damage?
Which traffic data can be integrated?
What is an anomaly in structural health monitoring?
Can existing sensors from other manufacturers be included?
Do I need my own software for AI analytics?
Project inquiry
Request a platform demo
Tell us about the structure and the measured quantities. We will show you AI analytics in a demo and assess what it can do for your structure.
+49 6742 8599600 DE +41 41 670 00 11 CH [email protected]